Sentry
What is sentry ?
TL;DR
- It provides a platform for the development team to collect, track, and handle errors, exceptions, and crashes in real-time within the application.
- It automatically captures errors that occur in the application and provides relevant information to trace error scenarios, allowing us to quickly pinpoint and resolve issues.
- Through Sentry's web interface and notification mechanism, we can easily track error reports and collaborate with team members to improve software quality and user experience.
- It monitors frontend errors and performance metrics, offering a comprehensive frontend performance solution. Sentry is an open-source system error monitoring software that can be embedded in various languages and frameworks, providing free quotas and storage for members to assist in error collection and system performance monitoring. For those capable of managing their own servers, the source code can be downloaded and self-deployed.
Principle
Sentry has rewritten the window.onerror and window.onunhandledrejection methods. It has added various runtime information to assist in error localization and unified the encapsulation for handling browser differences. Additionally, it listens to the unhandledrejection event and errors generated by Promises.
Common Frontend Errors
-
Resource Loading Error like CDN、 img、script、link、audio、video、iframe ...
-
Promise Error、unhandledrejection
-
Page crash
Integrate Sentry into the project
Here are the steps to integrate Sentry into the project:
- Apply Sentry account
- Create project
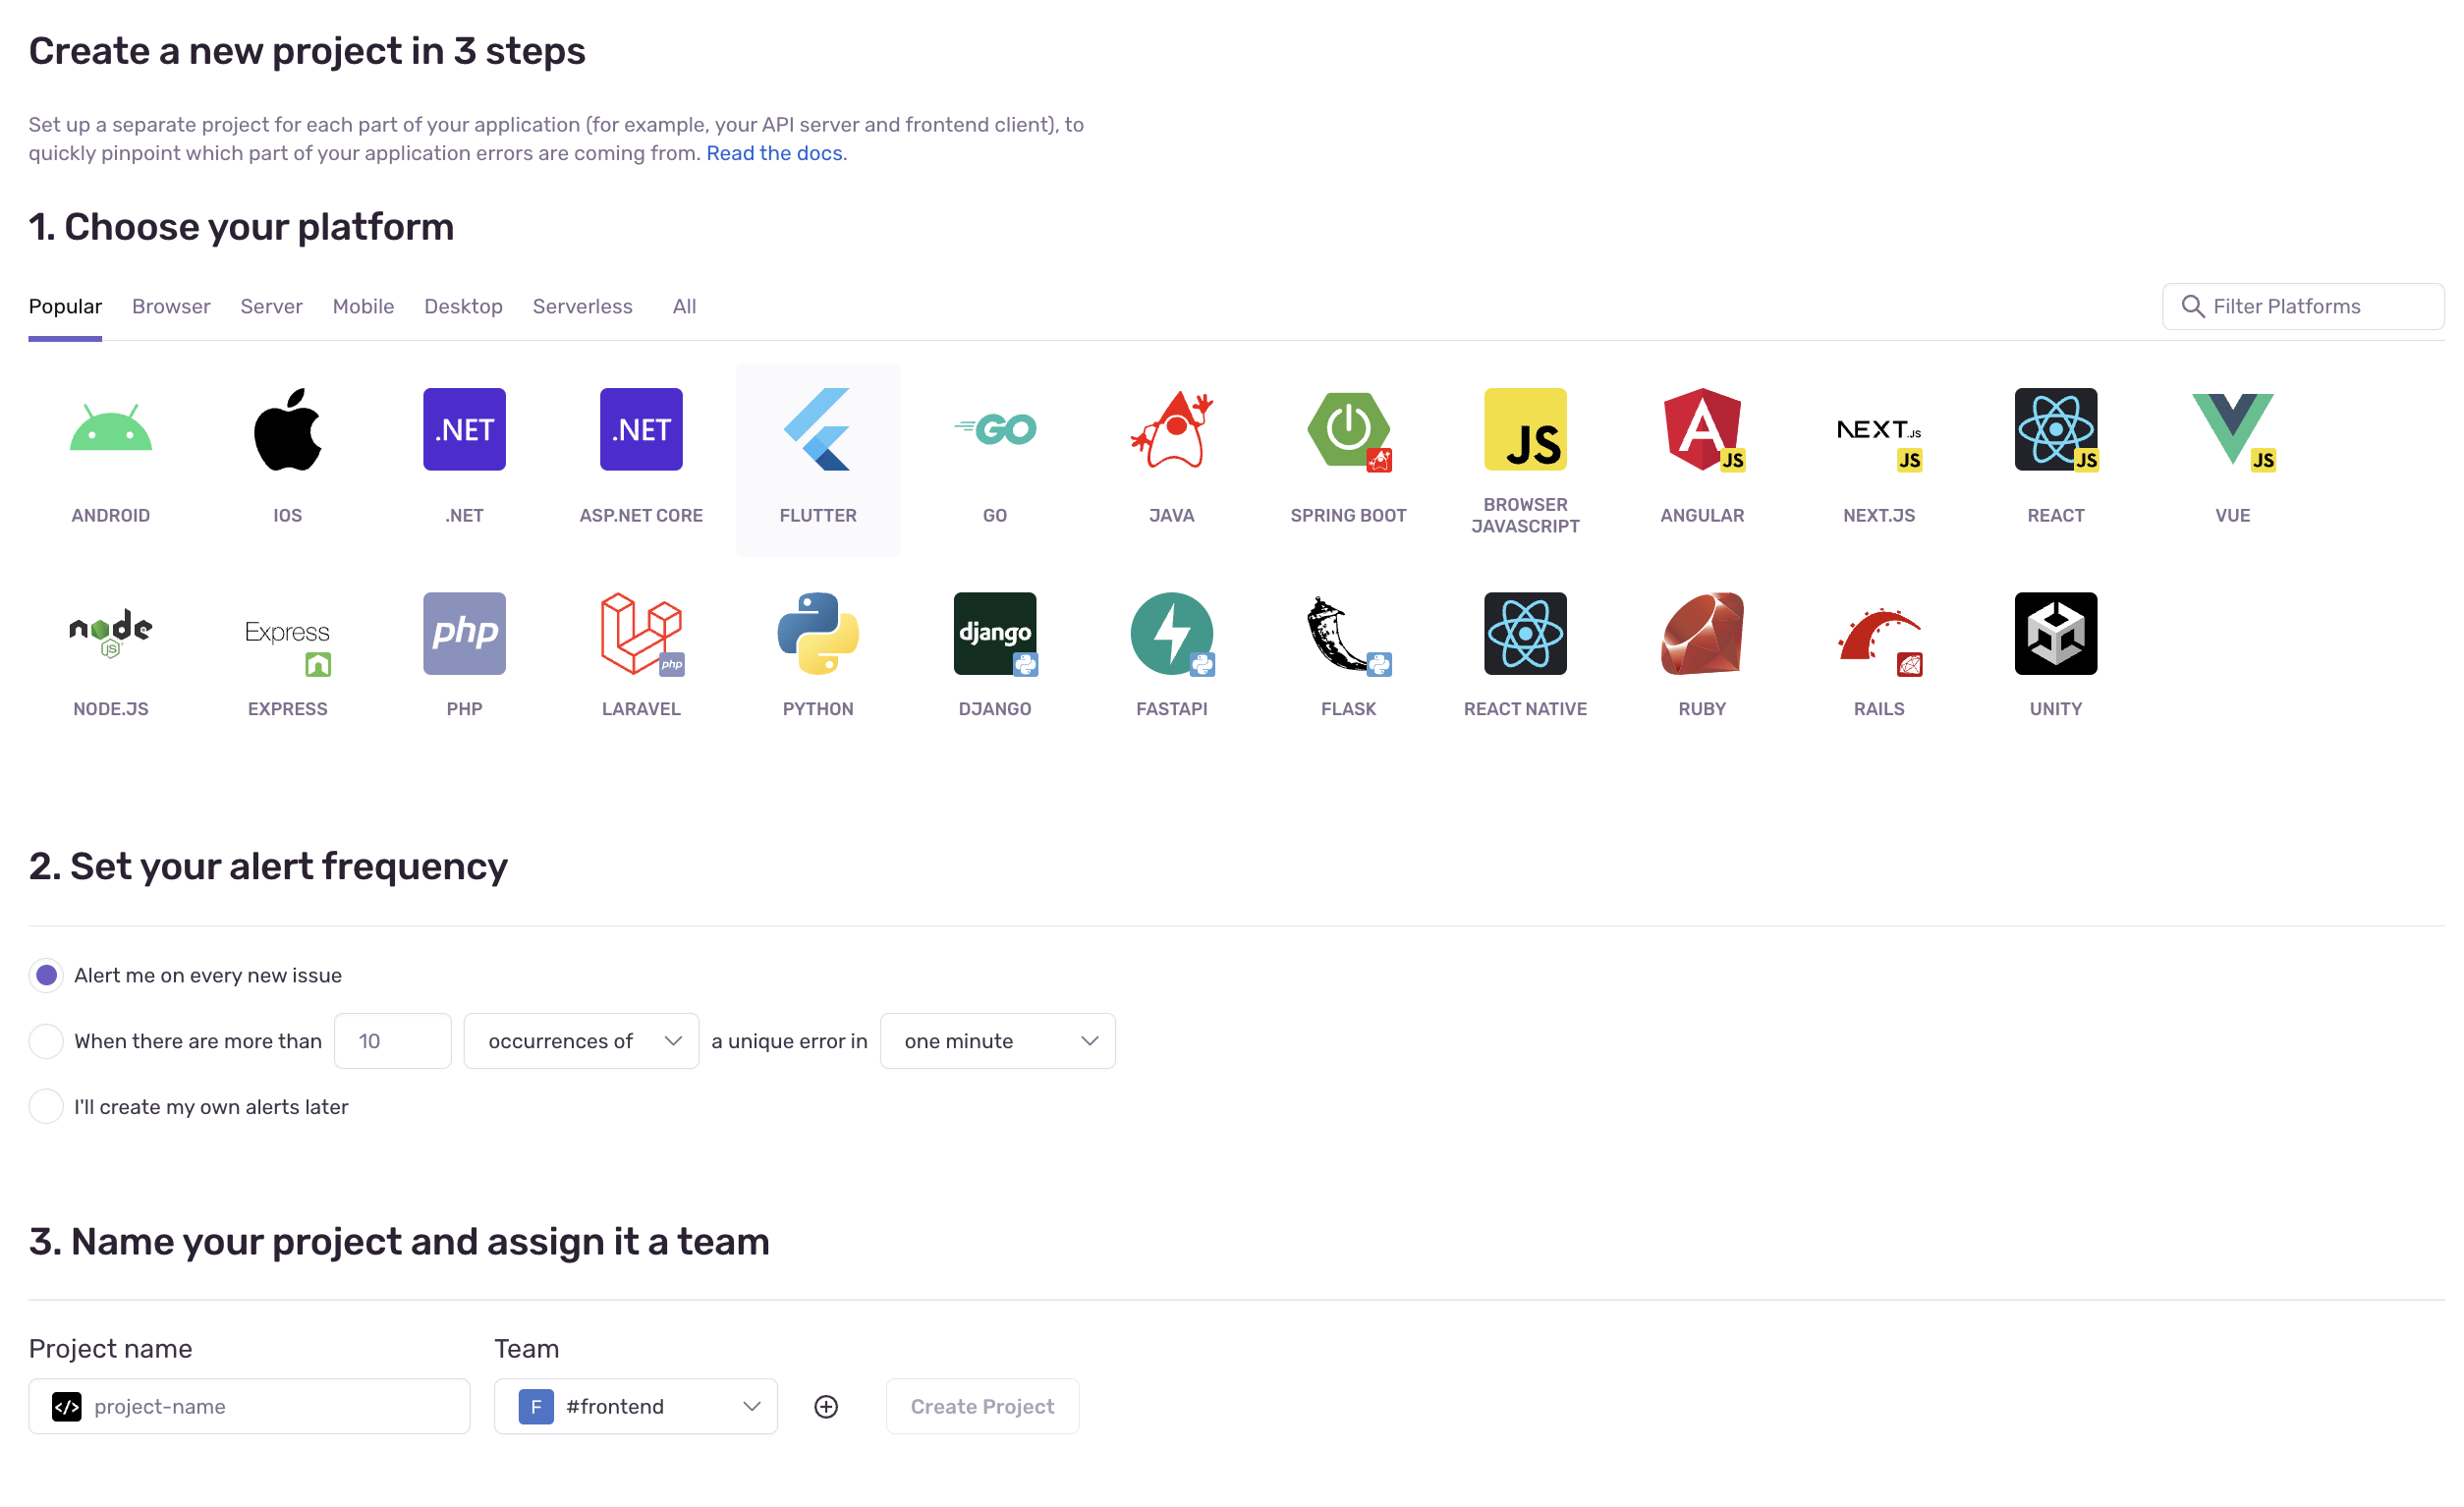
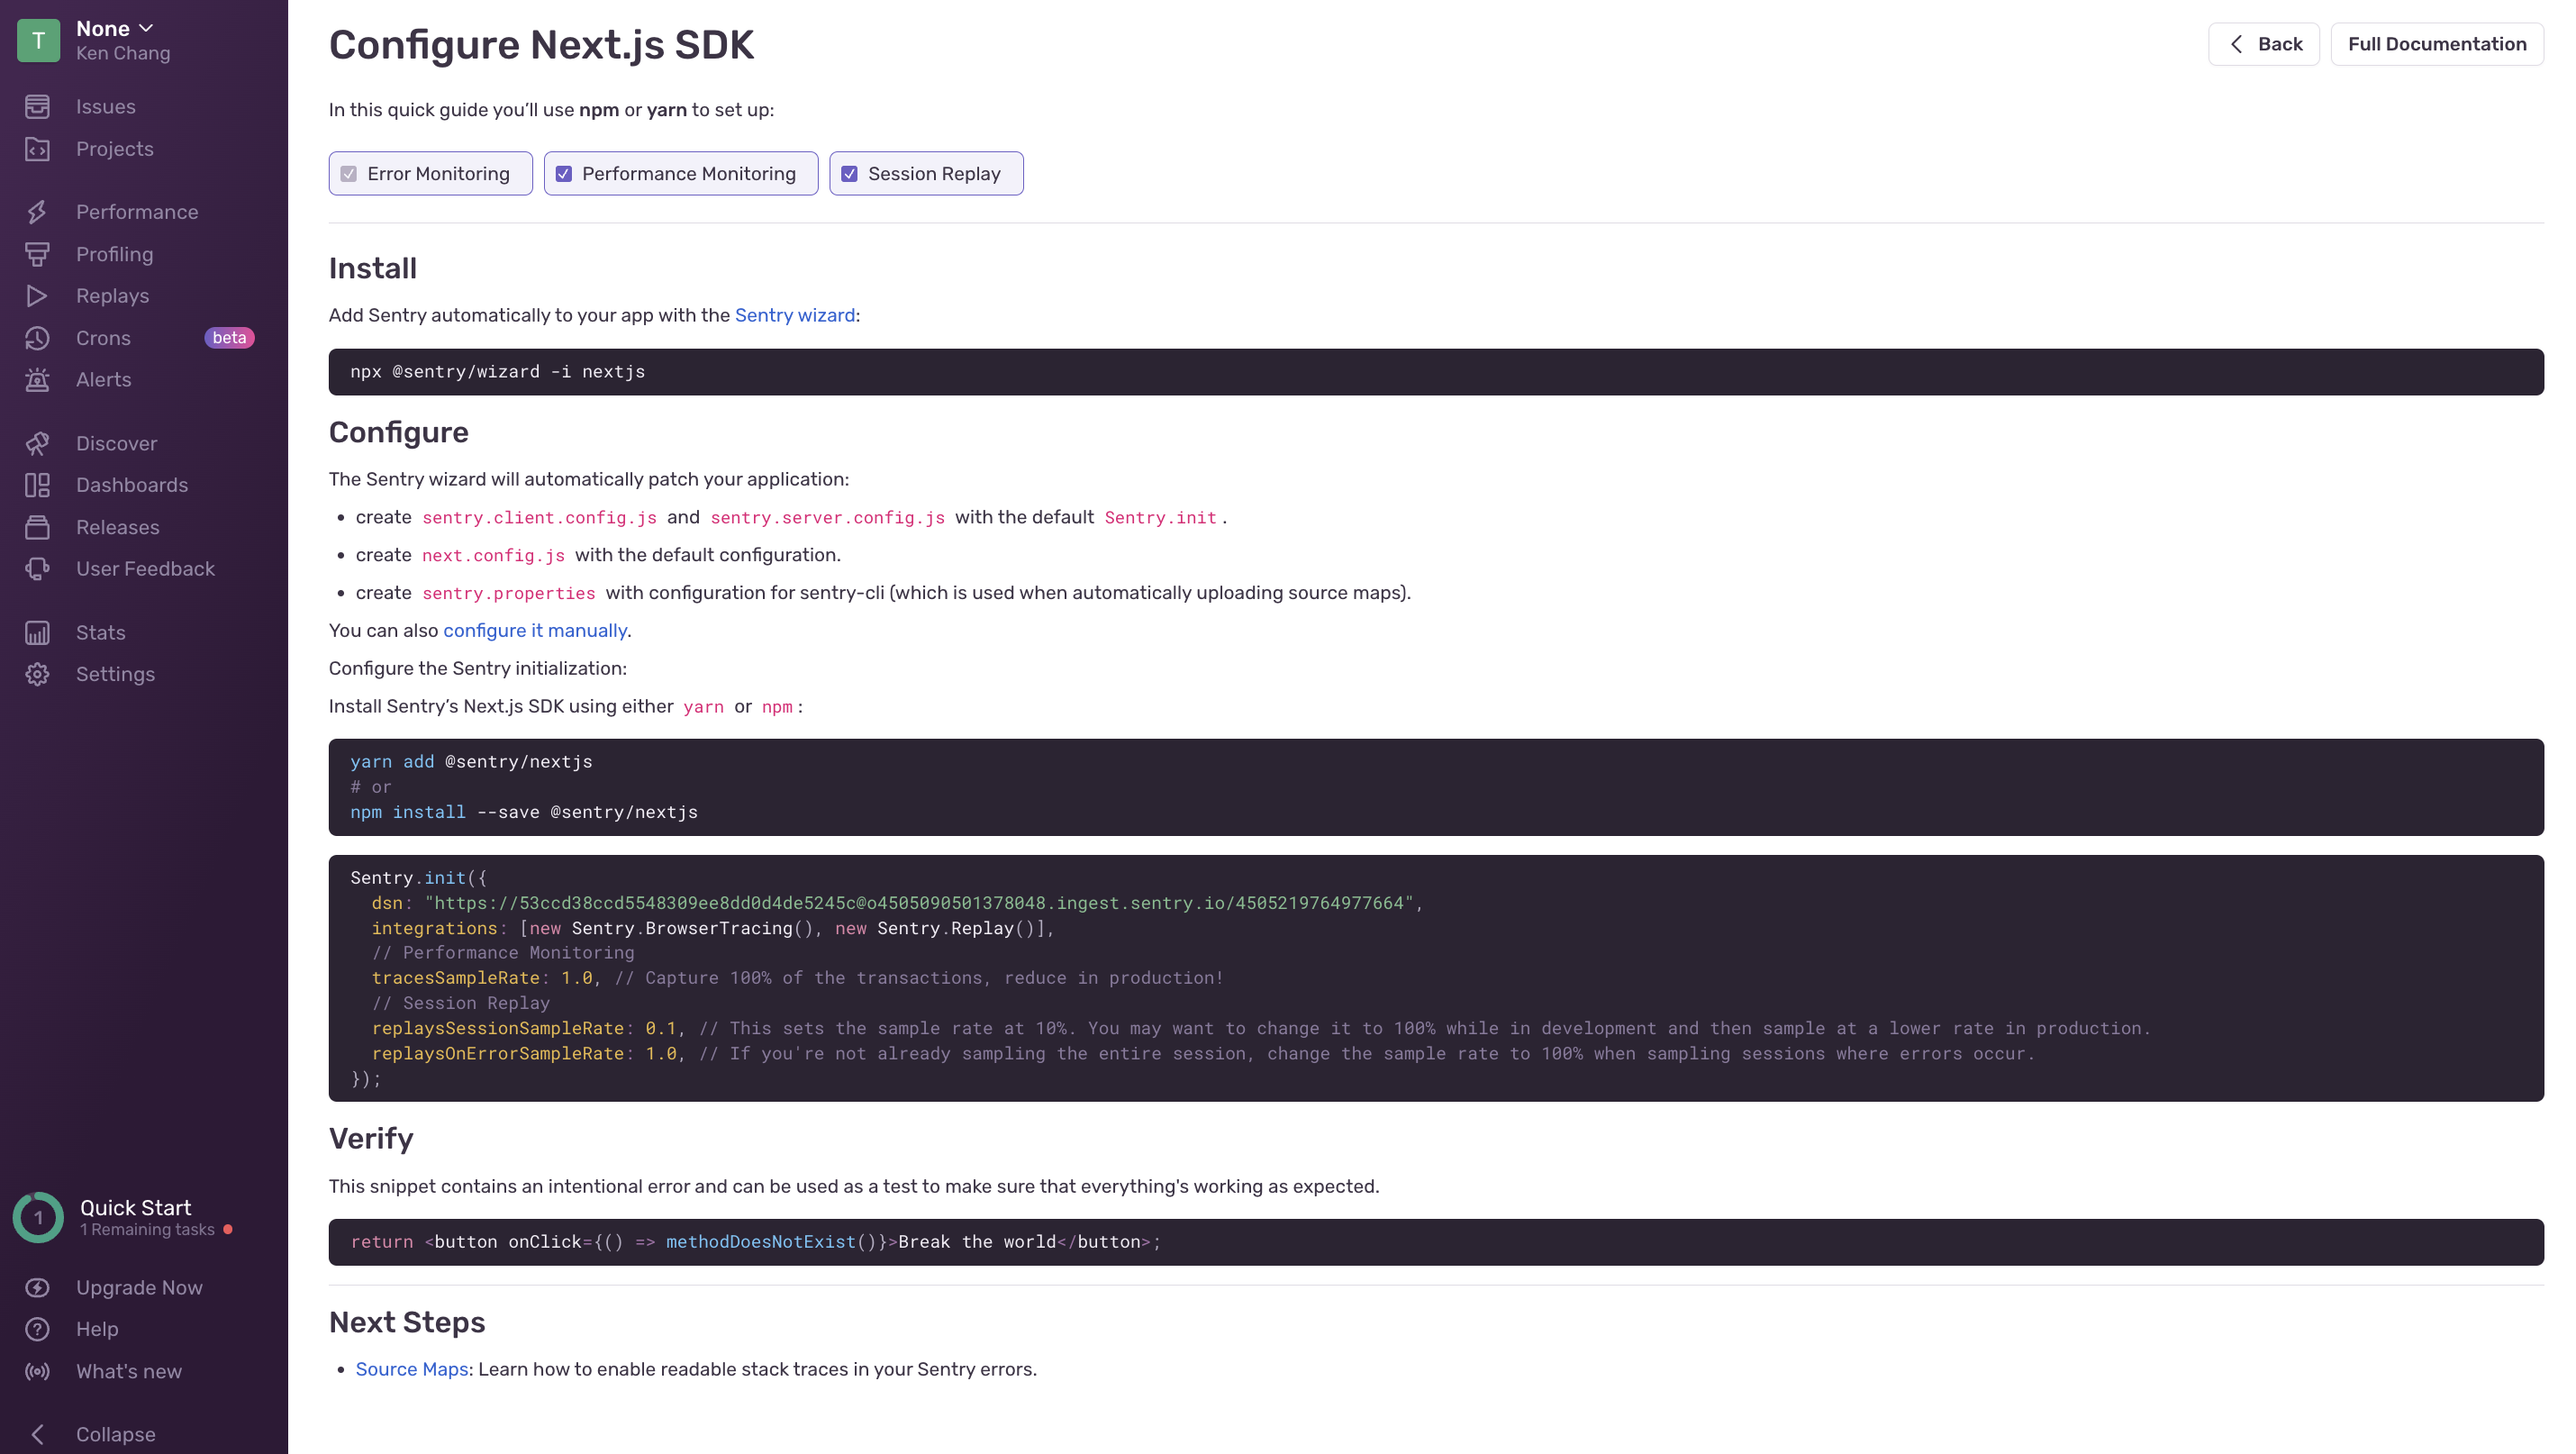
- Initialize the Sentry SDK in the project
npx @sentry/wizard@latest -i nextjs
Next.js official examples
https://github.com/vercel/next.js/tree/canary/examples/with-sentry
Common Options
The Sentry SDK can be configured using various options. These options are generally standardized within the SDK but may have some differences to better adapt to platform-specific features. The following options are set during the initial initialization of the SDK:
-
DSN(Data Source Name)
-
A
DSNtells a Sentry SDK where to send events so the events are associated with the correct project. -
If this value is not provided, SDKs will try to read it from the SENTRY_DSN environment variable, where applicable. This fallback does not apply in cases like a web browser, where the concept of environment variables does not exist.
dsn: "https://<key>@sentry.io/<project>"; -
-
Environments
- setting environment
environment: "dev"; // dev, stag, prod -
Release
- Specifies the environment in which the application is running, such as "production" or "development". It helps to differentiate errors between different environments.
Advanced settings
tunnel

tunnelRoute: "/monitoring"
- When using a Content Delivery Network (CDN), ad blockers or script-blocking extensions may prevent the Sentry SDK from being correctly fetched and initialized. As a result, any calls to the SDK API will fail and may cause unexpected behavior in your application.
- Using the tunnelRoute can bypass the blocking of the Sentry SDK by ad blockers and script-blocking extensions, ensuring that the SDK can be fetched and initialized properly and that captured data can be sent to the Sentry server. This way, your error reports, session health, and performance data can be successfully delivered to sentry.io, ensuring the availability of monitoring and analysis features.
- Using relative URLs will not trigger preflight CORS requests, and therefore, they will not be blocked by ad blockers as they do not consider these events as third-party requests.
ignoreErrors
The Sentry SDK catches all errors in the application and reports them to the Sentry server for monitoring and troubleshooting. However, there are times when you may want to ignore certain specific errors. These errors could be known and do not need to be reported, or they might be errors that do not affect the normal operation of the application.
  ignoreErrors: [
    // Random plugins/extensions
    "top.GLOBALS",
    // See: http://blog.errorception.com/2012/03/tale-of-unfindable-js-error.html
    "originalCreateNotification",
    "canvas.contentDocument",
    "MyApp_RemoveAllHighlights",
    "http://tt.epicplay.com",
    "Can't find variable: ZiteReader",
    "jigsaw is not defined",
    "ComboSearch is not defined",
    "http://loading.retry.widdit.com/",
    "atomicFindClose",
    // Facebook borked
    "fb_xd_fragment",
    // ISP "optimizing" proxy - `Cache-Control: no-transform` seems to
    // reduce this. (thanks @acdha)
    // See http://stackoverflow.com/questions/4113268
    "bmi_SafeAddOnload",
    "EBCallBackMessageReceived",
    // See http://toolbar.conduit.com/Developer/HtmlAndGadget/Methods/JSInjection.aspx
    "conduitPage",
  ]
sourcemap
when the code deployed to the production environment is minified. If we still want to monitor which specific line of code caused a script error, we need to upload sourcemaps to the Sentry backend.
- using withSentryConfig auto upload sourcemaps
const { withSentryConfig } = require("@sentry/nextjs");

const nextConfig = {...}

module.exports = withSentryConfig(nextConfig);
- using Sentry Webpack Plugin
const SentryCliPlugin = require("@sentry/webpack-plugin");

const config = {
  plugins: [
    new SentryCliPlugin({
      include: ".next",
      ignore: ["node_modules"],
      configFile: ".sentryclirc"
    })
  ]
};

// .sentryclirc
[defaults]
org = <my-org>
project = <my-project>

[auth]
token = <my-token> // Settings->Account->API->Auth Tokens
replay
Through Replay, you can observe users' actions, interactions, and processes within the application to gain a better understanding of the context and reasons behind errors occurring.
When error reports are captured and sent to the Sentry server, the corresponding session data is also collected and retained. This session data includes user behaviors in the application, such as clicks, inputs, and scrolls. With the Session Replay feature, you can select specific error reports and watch the actual user sessions when the errors occurred.
Principle: The rrweb technology is used to record all changes to the page's DOM (Document Object Model). It doesn't actually record videos; instead, it serializes the page's DOM state and records it. The recorded data is then deserialized to replay the DOM and reproduce the user interactions.

  // This sets the sample rate to be 10%. You may want this to be 100% while
  // in development and sample at a lower rate in production
  replaysSessionSampleRate: 0.1,

  // If the entire session is not sampled, use the below sample rate to sample
  // sessions when an error occurs.
  replaysOnErrorSampleRate: 1.0,

  integrations: [
    new Sentry.Replay({
      // Additional SDK configuration goes in here, for example:
      maskAllText: true,
      blockAllMedia: true,
    }),
  ],
Other
Sending messages to Sentry
try {
  aFunctionThatMightFail();
} catch (err) {
  Sentry.captureMessage("this is a debug message", "debug"); // 回報信息
  Sentry.captureException(new Error("Good bye")); // 回報錯誤
}
tracesSampleRate
To enable Performance Monitoring and expand the existing error data,
each Trace can track requests from the frontend to the backend across multiple services.This can be associated with the tracked error data, allowing you to see how errors propagate from one service to another. It also provides deeper insights into which services may have a negative impact on the overall performance of your application.
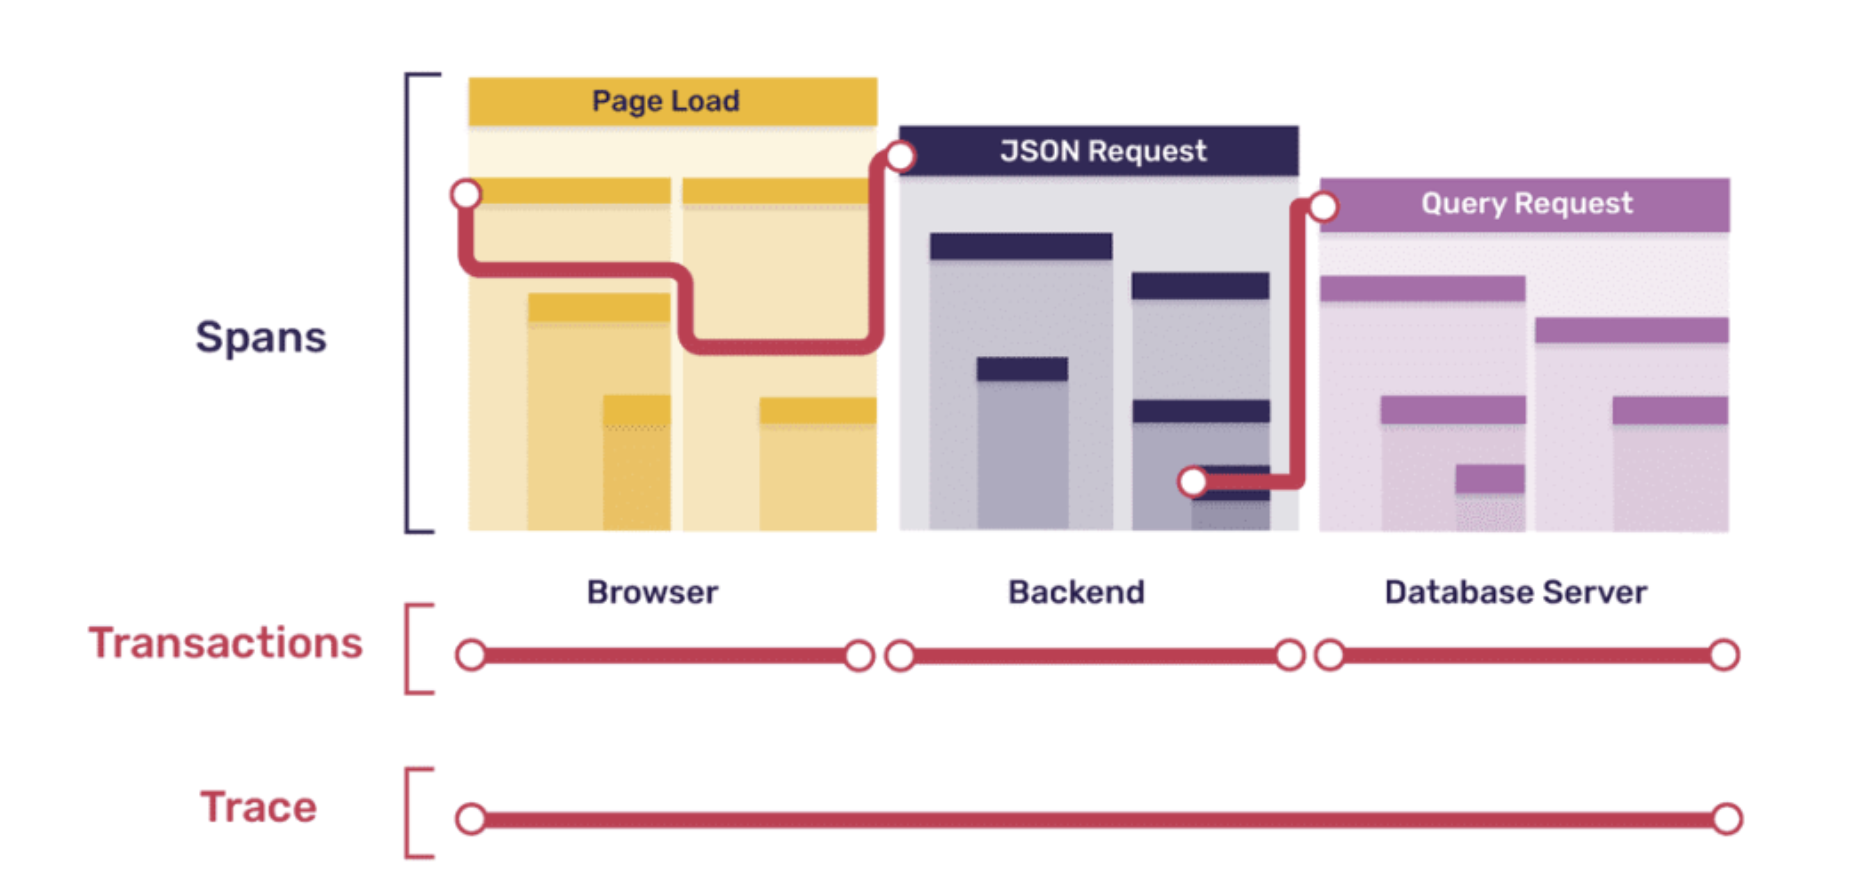 The browser sends the API to the backend to get a response in json format, and the backend sends a query to the DB to get the data
- Trace: A log describing events that occur during the program's execution is used to record the process of rendering the entire screen, such as browser page loading events or the checkout process in a shopping cart.
- Transactions: A trace includes multiple transaction services, encompassing the frontend, backend, and database.
- Span: span record a performance data, which can be roughly divided into three categories
- Records the loading of each static resource (js, css, img, etc.)

- API request

- DB When the above three types of Spans are all loaded and recorded, Sentry will package these spans into Transaction
- Records the loading of each static resource (js, css, img, etc.)
Controls the sampling rate of transactions (traces) to be captured and delivered to Sentry. The sampling rate represents the probability of a transaction being caught. For example, if tracesSampleRate is set to 0.1, only 10% of the traces will be captured and sent to the Sentry server.
tracesSampleRate: 1.0;
Performance monitoring - Web Vitals
![]()
It can count various indicators of Web Vitals, such as LCP, FP, and CLS, so that developers can see related charts in the background
Sentry price

Team Advanced
- Integrate with three-party resources (Slack, Github, Jira)
- When an error occurs, send an Alert reminder to the group
資安議題
Hosted on Google Cloud Platform
- All data in the Sentry server is encrypted at rest.
- After the data retention time expires, the data is automatically deleted.
- Enable server-side data scrubbing setting After, sensitive data (passwords, api_key, credentials...etc) will be filtered out.